Chocorua’s Bottom
by Rick Allmendinger, 2023
Gliding along the surface of Chocorua Lake in a kayak, our attention is drawn to the magnificent scenery, the breeze on our face, and the pristine shoreline with the occasional boathouse visible among the trees. Swimming is a more intimate experience: the silky feel of the water, our toes touching the stony, sandy, or mucky lake bottom, suddenly realizing that we share the water with an astonishing variety of living things. Though we admire the topography surrounding the lake, we seldom think about the fact that the lake bottom has its own topography, referred to as “bathymetry.” The shape of the land surface, above or below water, tells a story of the natural forces and processes that shaped the earth—how mountains and lakes came to be.
Rick’s kayak setup. Click for a larger view. Photo: Rick Allmendinger
I’ve long been fascinated by the surface features that give the Chocorua basin its distinctive character: the eskers, kettle holes, kame terraces, and moraines that record the advance and retreat of the ice sheet over this region during the last few tens of thousands of years. But that picture was incomplete without knowing what went on beneath the water. In 2022, a sonar device no bigger than a billiard ball allowed me to explore the bottom of the lake with a level of detail no one has seen before. The device recorded the water depth beneath my kayak every second and sent it wirelessly to my phone, which used GPS to record the position on the lake to within 5-10 meters (~15 to 30 feet). All I needed to do was paddle…a lot!
Rick’s kayak routes. That’s a lot of paddling! Click for a larger view. Image courtesy of Rick Allmendinger.
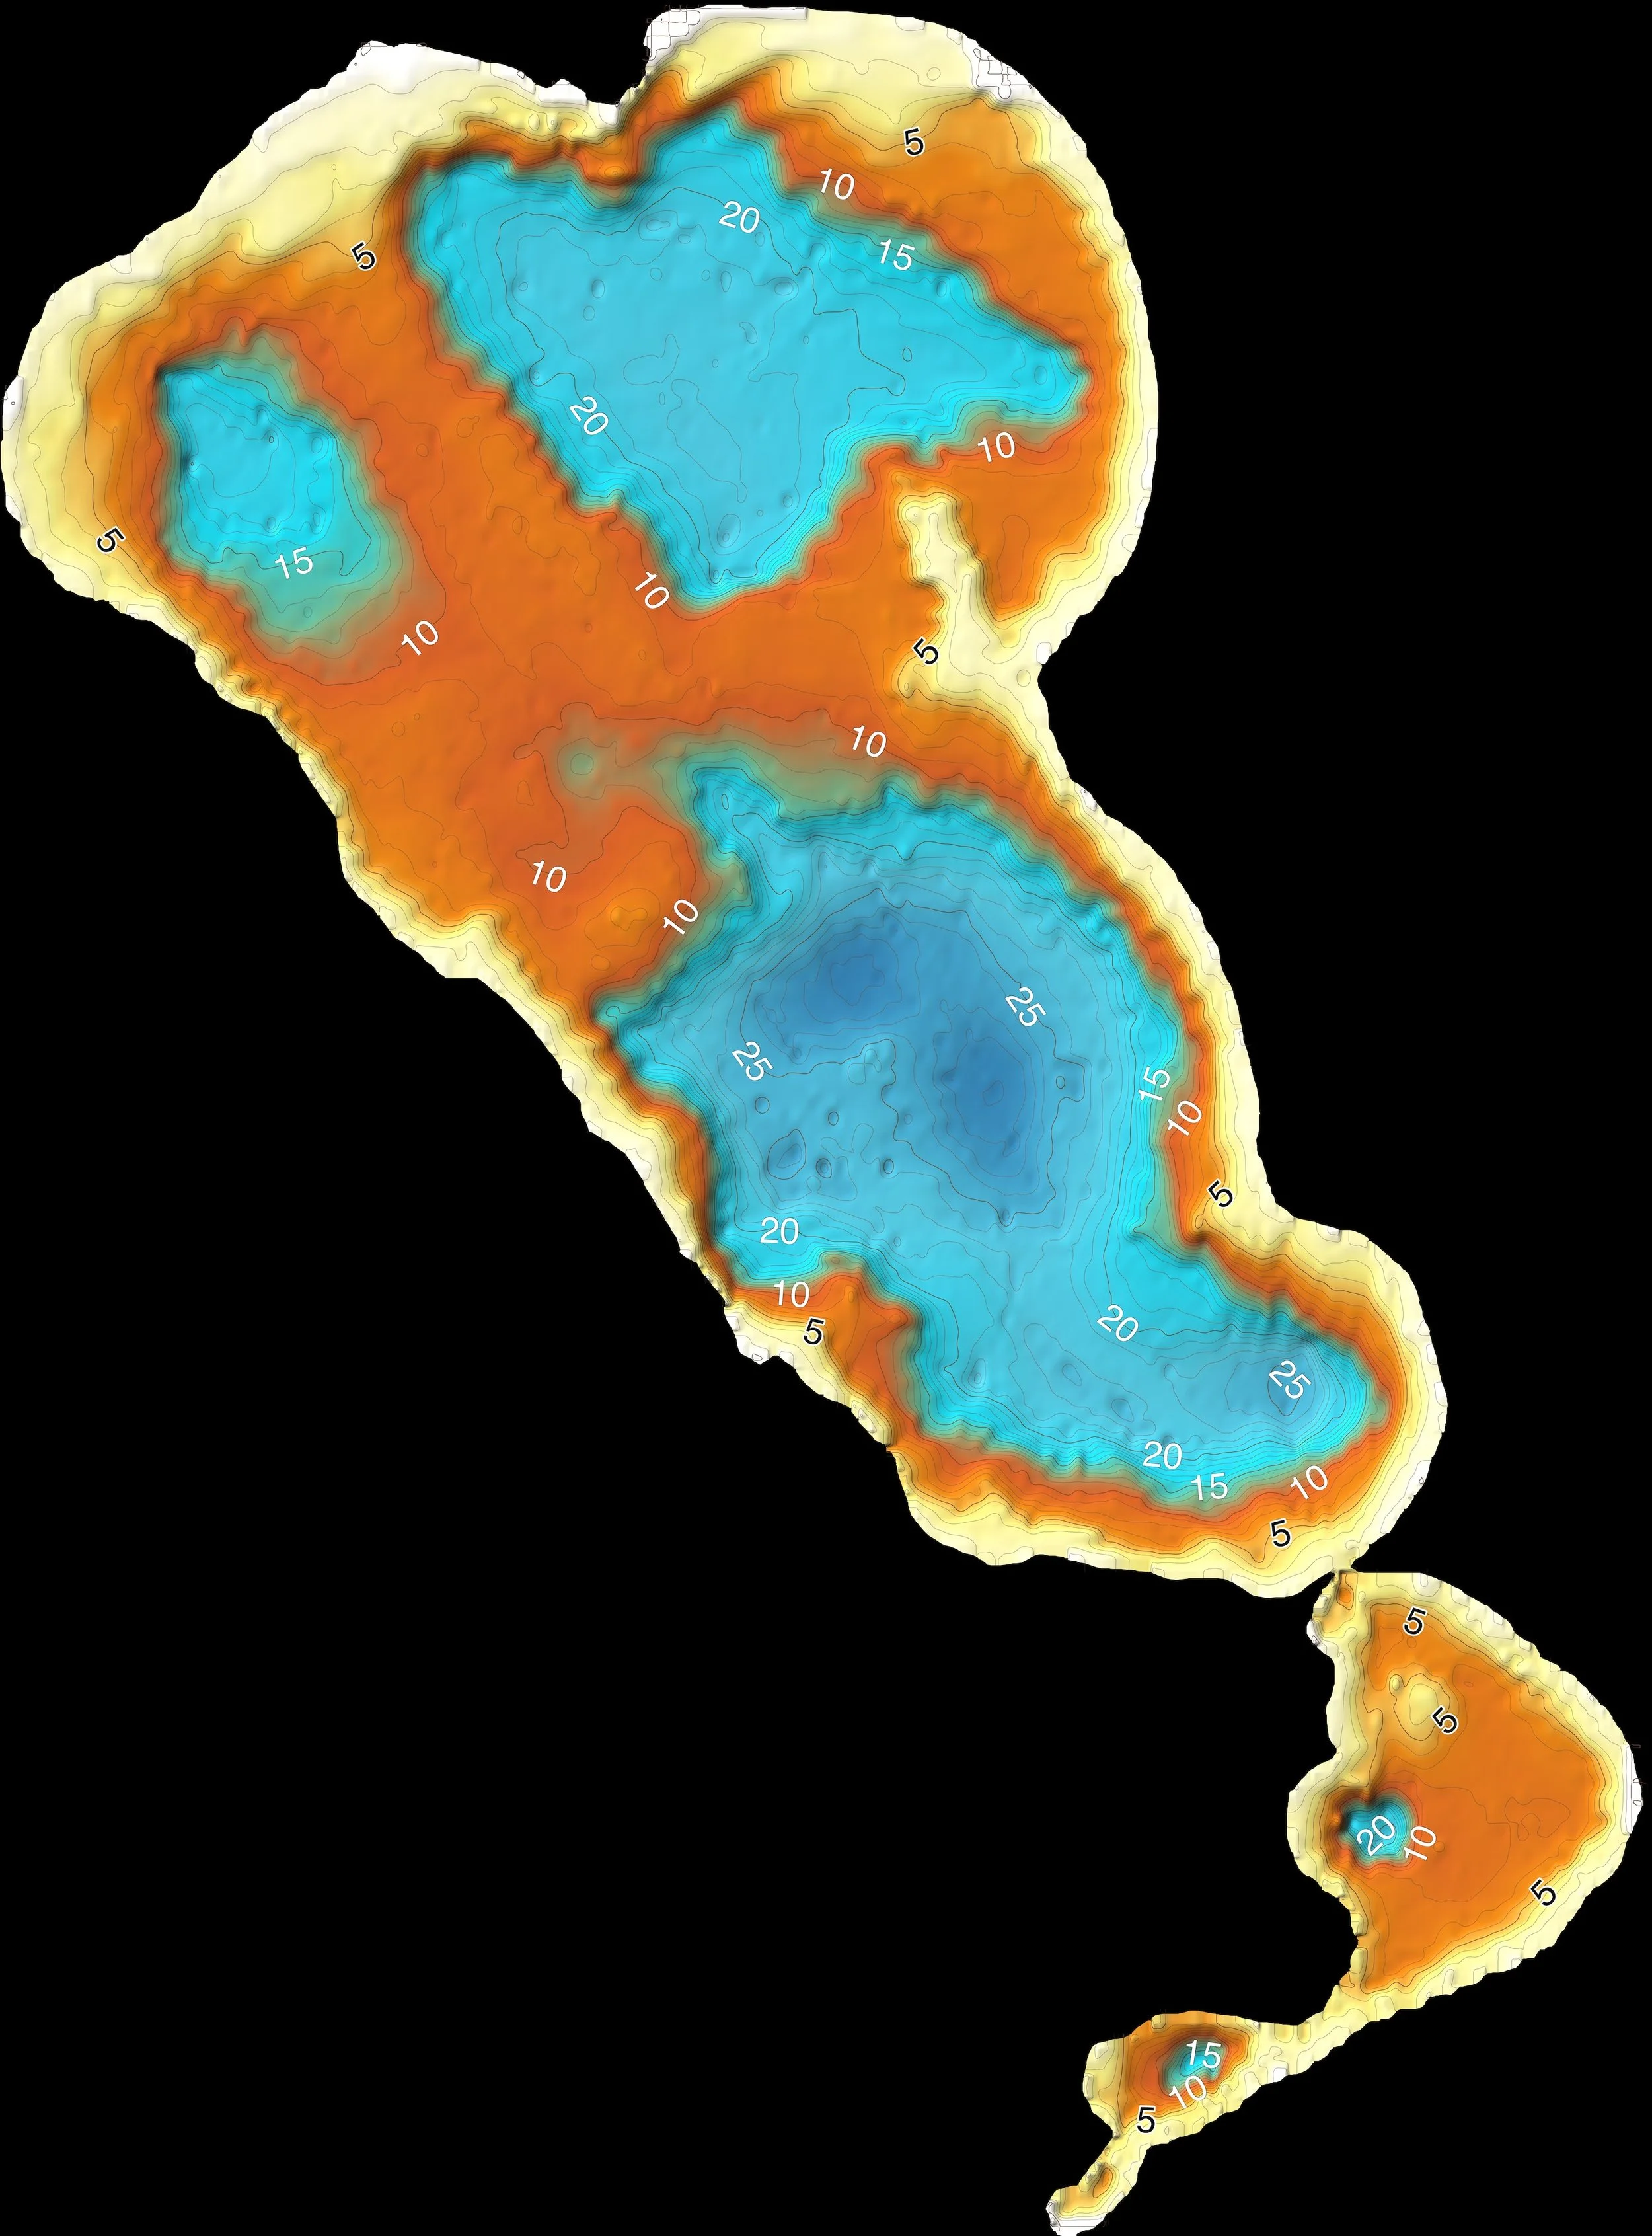
Nearly 50 miles of paddling and 70,000 latitude, longitude, and depth points later, I had the data necessary. But that many numbers are hard to grasp, so the next step was to devise a way to visualize the results. Because kayak tracks are irregular, the data needs to be converted into a regular grid that can be imaged with color and shaded relief. That grid was constructed on a one meter spacing, which meant that the resulting 5.5 million points included a whole lot of interpolation. It is impossible to know the shape of the land perfectly, though LiDAR data provide a good approximation of the topography above water. Though the gridding procedure samples the lake at the same interval as LiDAR, the actual resolution is much worse. The sonar occasionally spits out artifacts related to incorrect depths; interpolation and smoothing is used to suppress those bad data points. Nonetheless, this new image of the lakes, from the dam to the north end of the Big Lake, is vastly better than anything we’ve had before. The deepest point is about 30 feet, located in the middle of the Big Lake about one third of the distance from the Narrows northward.
Chocorua Lake bathymetry map. Click for a larger view. Image courtesy of Rick Allmendinger.
The resulting map provides some surprises: The Big Lake is composed of three sub-basins, each more than 20 feet deep separated by shallows less than 10 feet deep. The basins are remarkably flat-bottomed with steep sides. The southern and deepest sub-basin, whose outline reminds me of a bunch of grapes, has a curious, stem-like feature at its northern end. It appears to be a small, submarine paleo-channel oriented off to the northwest. Although the Little Lake is mostly less than 10 feet deep, there is a small “hole” on the western side that exceeds 20 feet. Finally, the central part of the Third Lake is also surprisingly deep at nearly 20 feet.
The map has practical value in that it shows us what the natural lake system might have looked like before the dam was constructed, raising the lake level by three to four feet. The pale yellow on the map would have been land. Water may have trickled through the Narrows, but no boat would be able to pass under the bridge. The shallows between the Little Lake and Third Lake would have been wading depth only—if that! Unsuspecting sailors have long caught their centerboards in the shallows just north of the Island; this would have been a peninsula before the damming of the lake. Drop the water level by just ten feet and you would have three separate lakes where the Big Lake now sits and two very small ponds south of the Narrows.
We can only speculate about what the shape of Chocorua’s bottom tells us geologically. My interpretation is that the steep-side and flat-bottomed nature of the three sub-basins in the Big Lake suggest three stagnant, remnant blocks of ice, with the area in between, perhaps originally formed by crevasses between the blocks, filled in with debris. The paleo-channel-like feature at the north end of the southern sub-basin remains enigmatic, but is generally aligned with paleo-drainages on the west and northwest side of the basin. The holes in the Little and Third Lakes may also have been formed by smaller stagnant ice blocks, or perhaps these holes and sub-basins were separate lakes prior to the arrival of the ice cap.
Take these interpretations with a grain of salt: a different geologist looking at the same data might come to very different conclusions! The view of the bathymetry inspires one’s imagination as the topography surrounding the lake does. To know more about our natural surroundings increases our perception of the wonder and beauty that we are privileged to enjoy, and also of the fragility of those surroundings. The lakes are not ordained to be unchanging. Indeed, the map emphasizes how profound small natural or human-made changes could be. Shallow lakes are vulnerable to changes in drainage patterns, sediment supply, and eutrophication (an excess of nutrients that can overstimulate plant growth and harm animal life from a lack of oxygen) as a result of climate change or well-intentioned but poorly planned engineering projects.
Just when you think that there is nothing left to discover, you’re one of the first people to see the shape of Chocorua’s bottom. To learn something new about a place for which we care so deeply is magical. All it took was a little bit of paddling!
New Hampshire native Rick Allmendinger has a lifelong relationship with the Chocorua Lake Basin. Professor Emeritus at Cornell University, where he taught structural geology, regional geology, and energy and climate change, Rick is the creator of the Chocorua Map app.